Use the Discover tool to view and sort your data
Use the Discovery screen in EZproxy Analytics to view and sort your data.
Access the Discover tool
- Sign in to your EZproxy Analytics site using the username and password provided by OCLC. Your EZproxy Analytics dashboard opens.
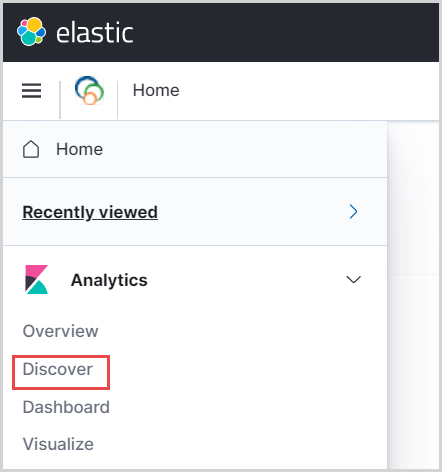
- Click on Discover in the left panel. Your log data appears in the left pane of the screen. When no filters are selected, the log displays by Time and _source. Use filters and fields to refine the data.
Note: To expand or hide the left panel, click the
 icon at the top of the menu.
Use the Discover tool
For information about how to sort and filter the data in the Discover tool, see Kibana Guide > Discover. Use the KQL queries to explore your log data. Please note, this documentation is provided for reference only and is not supported by OCLC. The user interface and access points may look different from OCLC-supported EZproxy Analytics.
The search box uses KQL language. Use the KQL link next to the search box for assistance with this language. All data present in your EZproxy and Audit logs are available to be queried. For a full description of your data fields, review your audit and ezpaarse data dictionary dashboards.
Select the log index to use
Your Audit logs and your EZproxy logs are processed into EZproxy analytics into three separate log indexes:
- audit-*: Displays information about who is accessing the data. Information is loaded on a nightly basis.
- ezpaarse-*: Displays access event data which shows which e-resources are being accessed and how. By using ezpaarse to enrich your EZproxy log data, we are able to provide more value than you would normally get solely from analyzing EZproxy logs directly. Information is loaded on a nightly basis.
- spu-*: Starting point URL data which shows how your e-resources are being discovered. Data is available in real-time.
Select available fields
- Discover screen (Image)
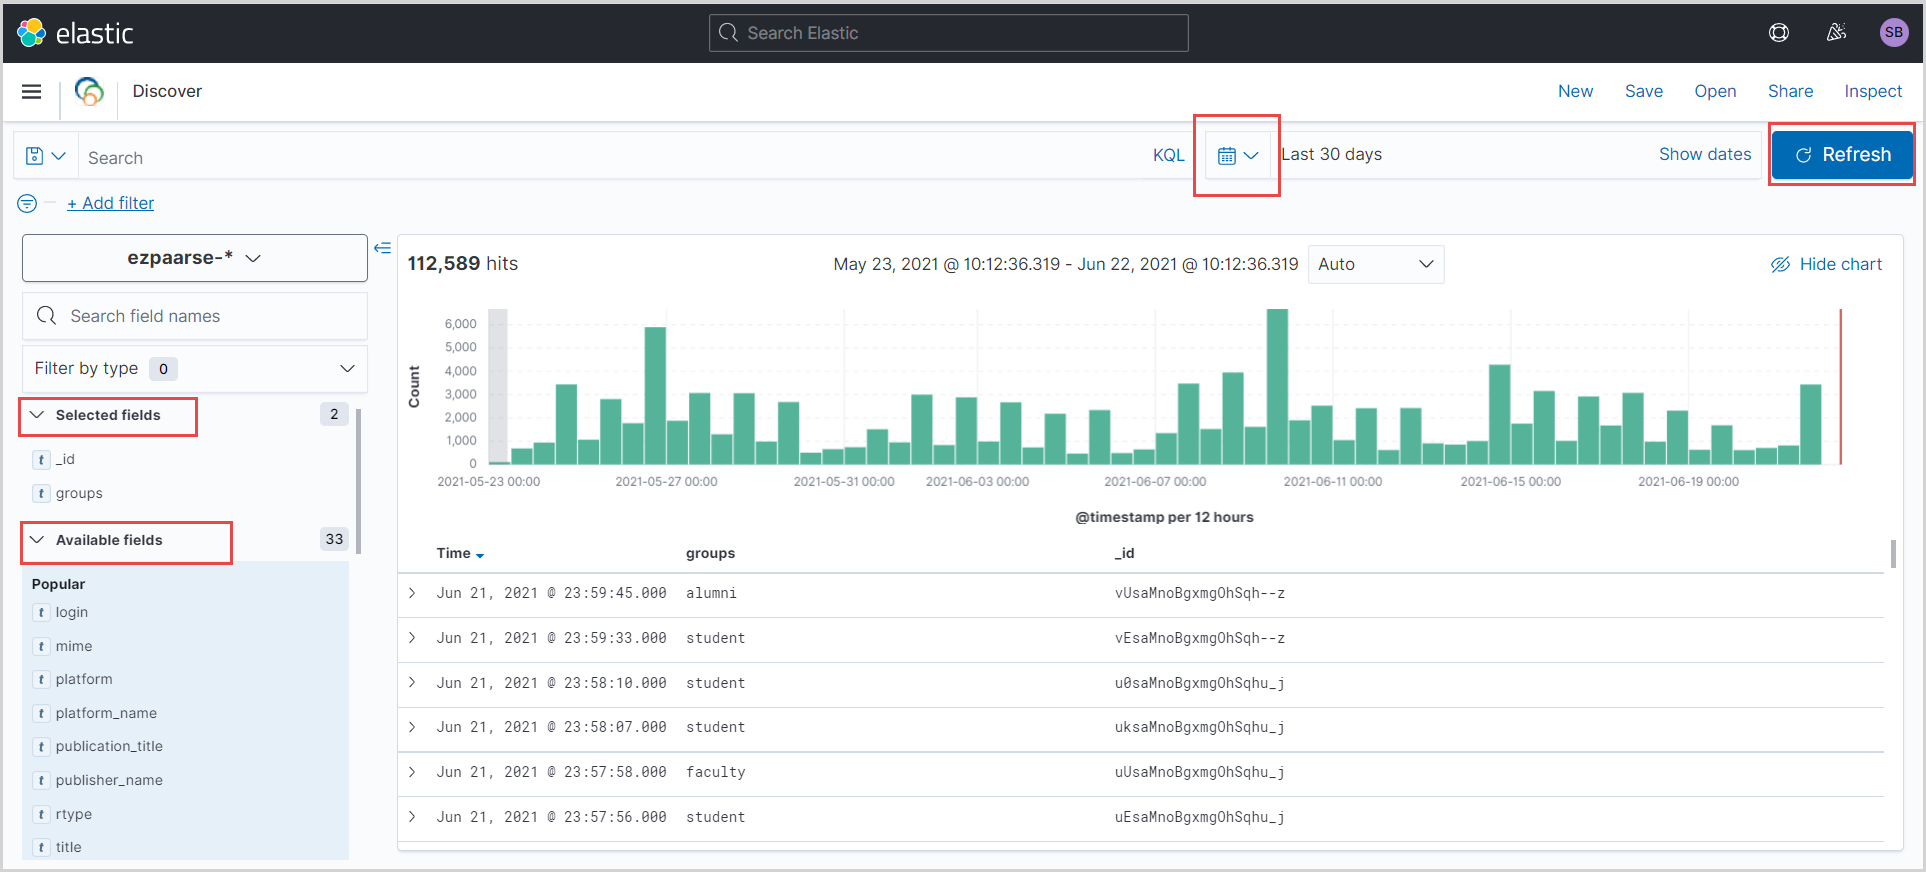
The data rows are sorted automatically based on the time the event occurred. The data columns further define information about the log event based on the selected fields.
- To add a field, select the plus sign (
 ) that appears next to the value when hovering with your mouse under Available fields on the left side of the screen.
 - To remove a selected field, select the X symbol (
 ) that appears next to the field when hovering with your mouse under Selected fields on the left side of the screen.
Ensure the type of data and date range is accurate for your desired analysis. The default date range is 30 days. You can expand this range to include any date range persistent throughout EZproxy Analytics.
- Select the calendar drop-down to alter the date range.
If your data does not automatically update, click the Refresh button.
Search and filter in the Discover tool
Data within the Discover screen can be searched and narrowed down using the available fields. For more information, see Search and Filter.
Watch a video
Discover your data
Run time: 3:16
Learn how to use the Discover tool in EZproxy Analytics.