EZproxy Analytics dashboards
Dashboards allow you to combine one or more visualization onto one screen to enable easy decision-making.
Access dashboards
To access existing dashboards and create your own:
- Sign in to your EZproxy Analytics site using the username and password provided by OCLC. Your EZproxy Analytics dashboard opens.
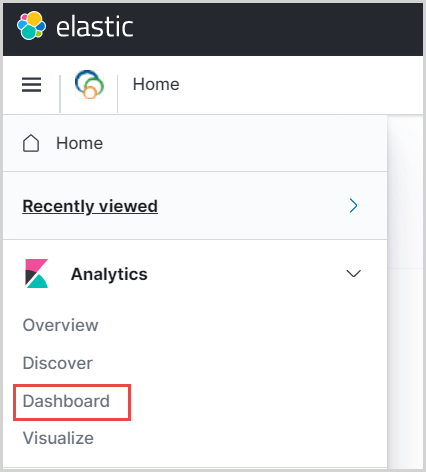
- Click on Dashboard in the left pane. A table of available dashboards appears, displaying the Title, Description, and available Actions.
Note: To expand or hide the left panel, click the
 icon at the top of the menu.
Available dashboards
EZproxy Analytics comes with a number of out-of-the-box visualizations to allow you to quickly put your data to use.
| Dashboard | Description |
|---|---|
| Access event terms | Describe terms used in the access event tables (index). |
| Audit event terms | Describe audit event terms. |
| Homepage | Your EZproxy Analytics homepage. |
| SPU and Access Event Dashboard | An out of the box dashboard designed to give you a look at your eResources. |
| Security dashboard | The place to review security events by looking at your audit logs. |
Zoeken

The Search option allows you to search within your dashboard, visualization, or in the Discover tool using specific criteria. Pre-selected fields from the Discover tool are available to use for searching. To see pre-selected fields, click the search box and select a field and operator from the drop-down menu. You can then type in a search term to narrow the results.
Filter
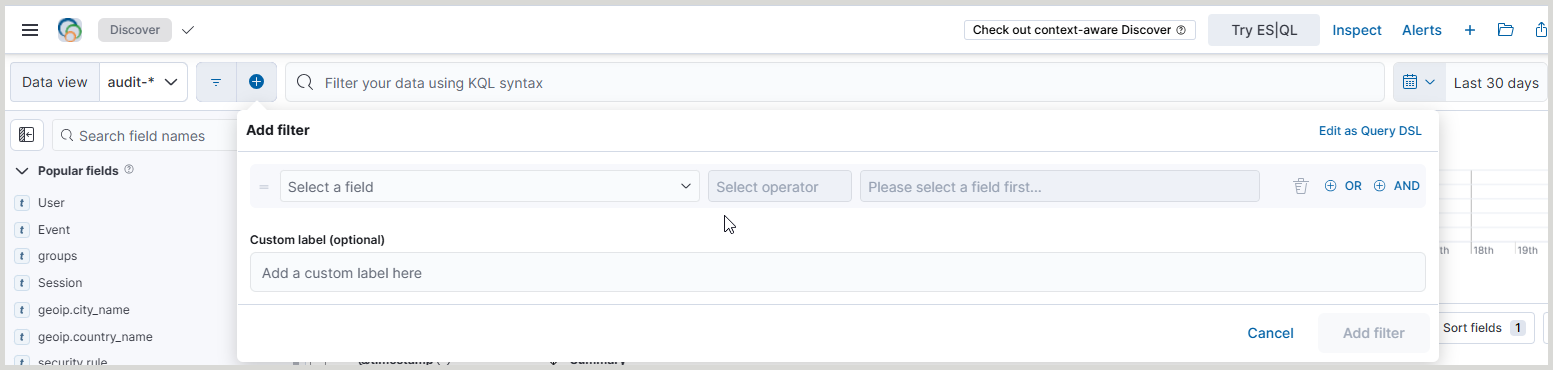
Multiple filters can be applied to a dashboard, visualization, or in the Discover tool at a time. Click Add filter to select a field to use for filtering the data. Select a Field and Operator from the respective drop-down boxes, then enter a value to filter by. Click Save to apply the filter.
Change all filters
Click the ![]() icon to the left of the Add filter option to open the Change all filters menu. This menu allows you to update multiple filters at the same time. The following functions are available:
icon to the left of the Add filter option to open the Change all filters menu. This menu allows you to update multiple filters at the same time. The following functions are available:
- Enable all
- Disable all
- Pin all
- Unpin all
- Invert inclusion
- Invert enabled/disabled
- Remove all
Date ranges

Use the calendar option to filter the data within the dashboard, visualization, or Discover tool by date. The default date range is the last 30 days. Click the calendar or the date search box to see more options for adjusting the timeframe.
Create dashboards
For information about how to create your own dashboards, see Kibana Guide > Dashboard. Please note, this documentation is provided for reference only and is not supported by OCLC. The user interface and access points may look different from OCLC-supported EZproxy Analytics.
Save and share dashboards

To save a dashboard:
Select the Save option in the upper right corner of the Create Dashboard screen.
To open a saved dashboard, find and select the title of your dashboard from the list of saved objects on the Dashboards screen. You can also use the search bar to retrieve a dashboard by name.
To share a dashboard:
From the desired dashboard screen, select the Share option in the upper right corner. Share options include:
- Embed code
- Permalinks
- PDF Reports
- PNG Reports