Reports
CONTENTdm offers two reports at the server level: Usage Summary and Item Types. For collection reports, follow the link.
If you have any of the server rights ("Add collections", "Delete collections", "Administer user rights", or "Setup global Website"), you will have access to these server reports, as well as collection reports.
For more advanced reporting, you may want to take advantage of CONTENTdm's integration with Google Analytics.
View server reports
- Open CONTENTdm Administration and select the Server tab.
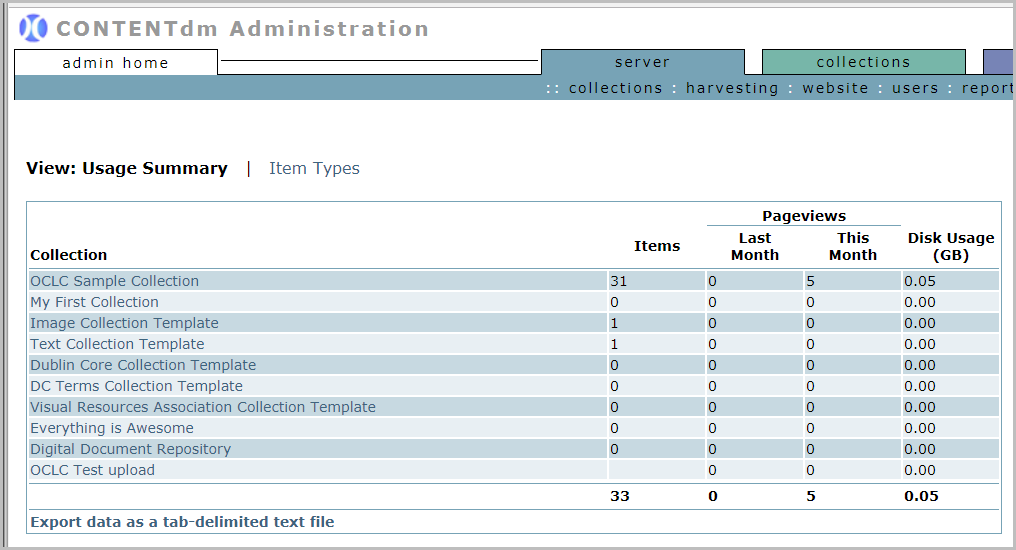
- Click reports. The Usage Summary report is displayed by default. (You can click the collection names to go to their respective collection report pages.)
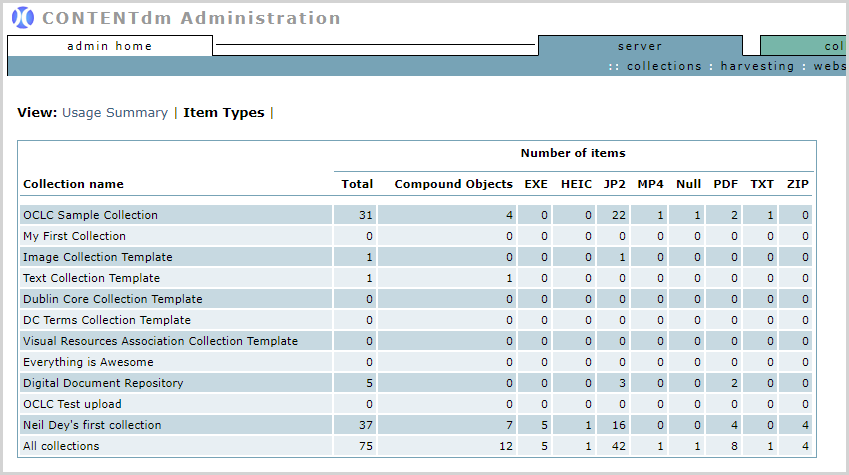
You can also Export data as a tab-delimited text file to get a spreadsheet of the report. - Click Item Types to switch to the other report.
Usage Summary

The Usage Summary reports:
- The total number of Items in each of the collections on the server.
- Pageviews. Web analytics industry leader Google Analytics defines a Pageview as "an instance of being loaded by a browser". In CONTENTdm:
- Any view of a CONTENTdm Item (single item or compound object) counts as a Pageview.
- Landing pages and search pages are not counted.
- Viewing the different components of a compound object does not add to the Pageview count for that object.
- Reloading the item from the same URL counts as a new Pageview.
- The amount of Disk Usage.
Pageviews are summed for the current month and the previous month. No other reporting periods are available in the Usage Summary. For older and/or more detailed data, see the collection-level Item Pageviews report. For finer-grained reporting, please take advantage of CONTENTdm's integration with Google Analytics.
Item Types
For each collection, this report displays the total number of items and the number of items of each type.
