
WorldShare Reports in Power BI release notes, September 2026
Release Date: 10 September 2026
Introduction
This release of WorldShare Reports in Power BI provides new features and enhancements, along with bug fixes. These features will help you manage more complex workflows, including:
- Analyze Document Delivery activity with two new standard reports for Tipasa libraries.
- Export the report data to CSV or Excel from the File menu.
Follow-up actions
In an effort to keep your staff informed of new features and changes, you may also want to consider these items.
| Action |
|---|
|
Reporting staff may want to refer to the 30 January 2025 release notes and the OCLC help documentation to familiarize themselves with the Power BI reports and general features, including exporting, bookmarking, and report favoriting. |
|
Staff who export report data using our new WorldShare Reports in Power BI will find the export option in a new location. Let your reporting staff know that data export now starts from the File menu rather than from an individual visual. The pre-existing data export via the More options button ( |
|
The new Document Delivery reports are available only to Tipasa libraries. Your WorldShare administrator may want to review staff roles to ensure that interlibrary loan staff have appropriate roles to access these new reports. |
New features and enhancements
Document Delivery reports for Tipasa libraries
You can now analyze your Document Delivery activity in Power BI using two new standard reports. Previously, this activity was available only in our Classic WorldShare Reports environment.
Both reports are available to staff with Tipasa permissions.
Document Delivery Activity Overview
This interactive report summarizes document delivery requests and fulfillments, including filled counts, average filled turnaround time, cancelled requests, and expired requests. You can review activity from four views and drill through to request-level detail from any of them:
- Overview
- Patron Status
- Patron Department
- Material Format
The report opens with a standard bookmark showing the last 12 calendar months. You can filter by date, request item material format, request patron status, request patron department, request item language, and request source system.
Example of the new Document Delivery Activity Overview report:

Example of the new Document Delivery Activity Overview drill through:

Note: The Document Delivery Request Statistics report in our Classic Reports platform will not be migrated to Power BI as a standalone report. Its views are now included in the Document Delivery Activity Overview report.
Visit Document Delivery Activity Overview for additional information and workflows.
Document Delivery Request Detail
This interactive report provides a detailed listing of document delivery requests for a given period, including request identifiers, item and article details, patron status and department, request source system, and turnaround time. You can open it directly or reach it by drilling through from the Document Delivery Activity Overview report.
The report opens with a standard bookmark showing the last calendar month.
Example of the new Document Delivery Request Detail report:

Visit Document Delivery Request Detail for additional information and workflows.
Export report data to CSV or Excel from the File menu
You can now export report data by selecting File > Export > Data (CSV/XLSX). Previously, you exported data from an individual visual, using the default Microsoft Power BI export capabilities.
To export data:
- Open a report and apply any filters you want reflected in the export.
- Select File > Export > Data (CSV/XLSX).
- Choose the visual you want to export, then select a format: CSV or XLSX.
- Select Export.
A notification confirms that your export has started, and a second notification appears when it is ready. Your file will download automatically. You can keep working on the report while an export runs, and you can run multiple exports at the same time.
Example of the new File menu export workflow:
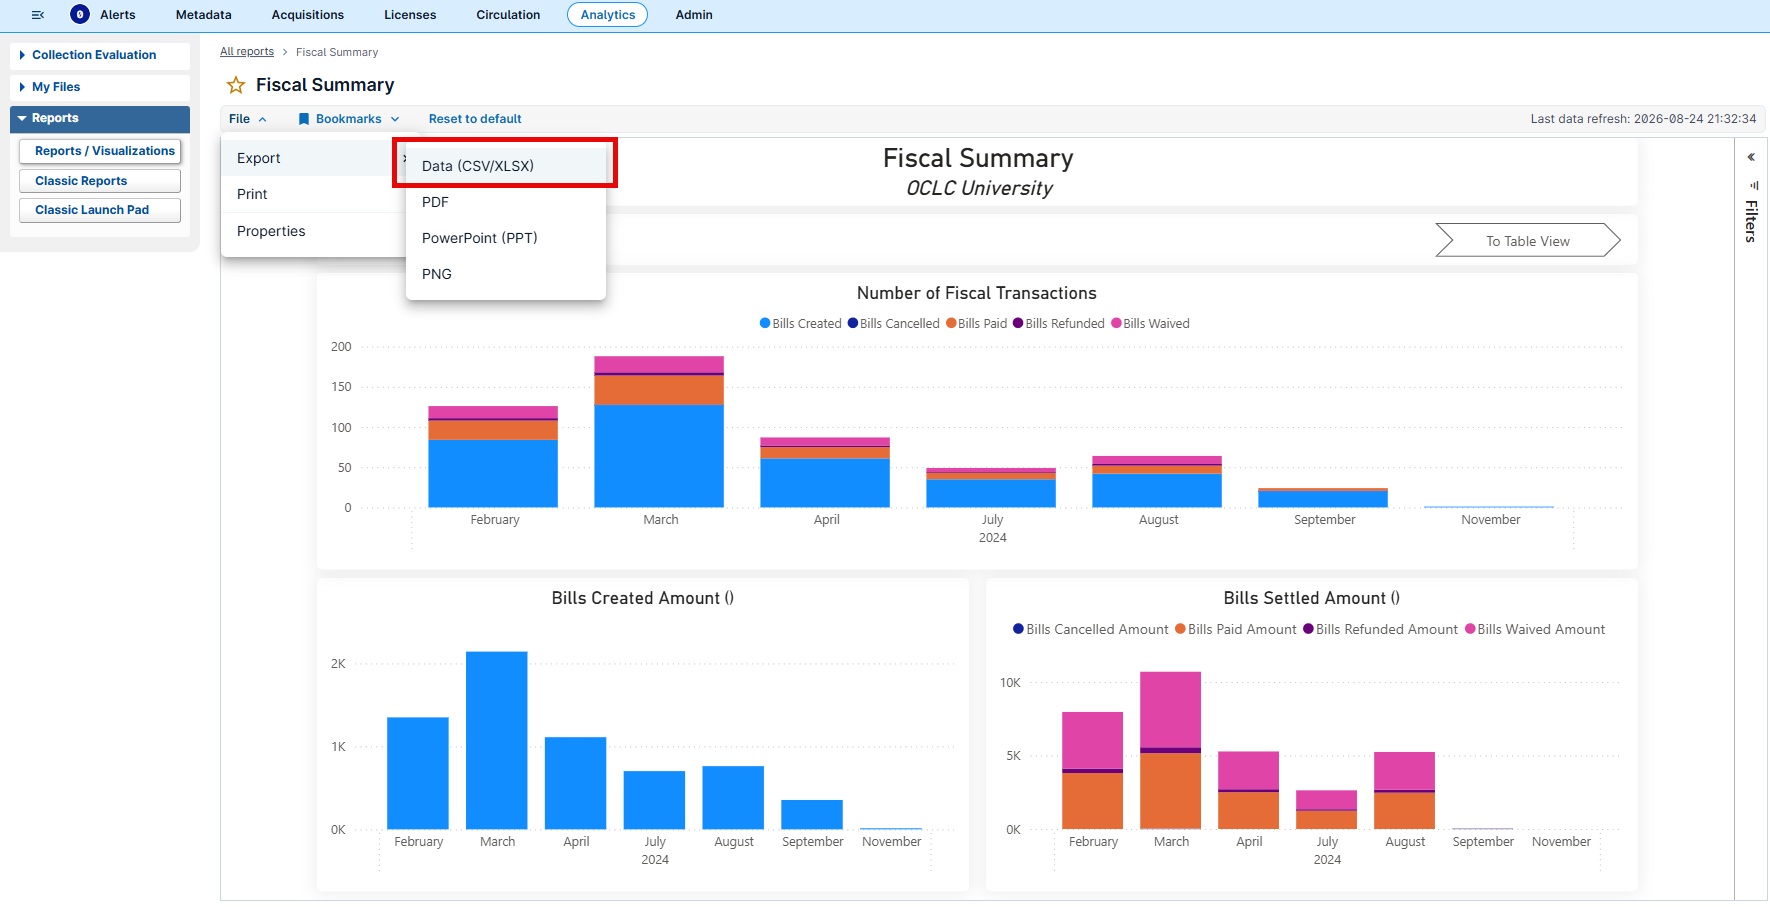

Note: Because exports now start from the File menu, we plan to retire the data export option in the menu on individual visuals in a future release. Exporting a report page as an image, PDF, or PowerPoint file is unchanged.
Note: Not every visual contains exportable data. Only exportable visuals will be available via the export dropdown menu.
Visit Export standard reports for additional information and workflows.
Bug fixes
Exporting data to .xlsx no longer results in an error
- Using our new Export Data option, you can now export data from all supported visual types to .xlsx. Exporting summarized data using the More options button (
 ) from certain visual types to .xlsx returns the error "File couldn't be created - Executing the Query for the Export Data operation resulted in an error."
Known issues
See the Known Issues page.
Important links
Support website(s)
Support information for this product and related products can be found at: