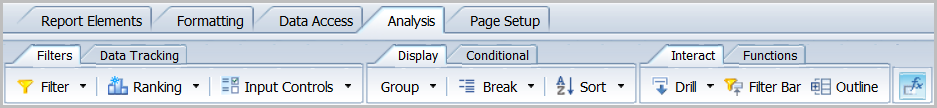
Design toolbox: Analysis tab
The Analysis tab consists of the Formula Bar button ( ), which displays or hides the formula bar under the design toolbox, and the following subtabs:
- Analysis tab
If a button is greyed out, it is not available for use.
Filters subtab
This subtab allows you to filter and rank elements as well as apply other input controls. Click anywhere in the report panel to activate all of the icons on the Filters subtab. The table below lists the options available on this subtab.
| Item | Button | Description |
|---|---|---|
| Filter |  |
Allows you to add, remove, or modify a filter on the selected element. |
| Ranking |  |
Ranks the current element relatively to a measure, which allows you to determine the top or bottom number (or range) of a given dimension based on the value of the measure. |
| Input Controls |  |
Allows you to insert other controls such as entry fields, radio buttons or list boxes. |
Data Tracking subtab
This subtab allows you to set up the tracking of changes from one time to the next when a report is refreshed. The table below lists the options available on this subtab.
| Item | Button | Description |
|---|---|---|
| Track |  |
Allows you to activate or deactivate data tracking mode. |
| Show Changes |  |
Allows you to show changes since the data was last refreshed.
This icon is available only when data tracking is activated. |
Display subtab
This subtab allows you to sort, assign control breaks, and group dimensions in a report tab. Click anywhere in the report panel to activate the Display subtab. The table below lists the options available on this subtab.


Conditional subtab
This subtab allows you to highlight values that meet or fail certain defined qualifications. The table below lists the options available on this subtab.
| Item | Button | Description |
|---|---|---|
| Formatting Rules |  |
Allows you to apply conditional formatting. This button is used to edit, duplicate or delete an existing assigned format based on the value of the selected object. |
| New Rule... |  |
Allows you to create a conditional formula which can be used to highlight specific values in the report. |
Interact subtab
This subtab allows you to drill up, drill down, and drill through reports, apply a filter bar to the top of a report, and scroll on control breaks. The table below lists the options available on this subtab.
| Item | Button | Description |
|---|---|---|
| Drill |  |
Allows you to navigate the report by hierarchy. Using this icon, you can set up objects in the report to drill into the values of the data based on the predefined Scope of Analysis. |
| Filter Bar |  |
Allows you to show or hide the report filter toolbar. The report filter toolbar allows the addition of any object used in the query as a filter. |
| Outline |  |
Allows you to show or hide the outline. It will provide the possibility to fold or unfold report elements based on a selected column. |
Functions subtab
This subtab allows you to dynamically count, summarize, average, or show the minimum and maximum of a select row or column of an object. The table below lists the options available on this subtab.
| Item | Button | Description |
|---|---|---|
| Sum |  |
Allows you to insert or remove a sum calculation. Click a measurement column (e.g., Expended Amount) to activate this icon. |
| Count |  |
Allows you insert or remove a count calculation. Click anywhere in the report panel to activate this icon. |
| Insert calculation |  |
Allows you to insert a new row at the end of the table or column with a calculation (average, minimum, maximum, or percentage) based on the selected value. |